> ## Documentation Index
> Fetch the complete documentation index at: https://doc.entelligence.ai/llms.txt
> Use this file to discover all available pages before exploring further.
# Budgets and outcomes
> Set project budgets, monitor burn, investigate untracked spend, and interpret Agent Insights outcome classes.
Budget shows where AI spend is going and whether projects are staying within their monthly limits. Outcomes shows what kinds of work that spend supported. Use the two views together: find a cost change in Budget, then inspect the work behind it in Outcomes.
Track monthly budgets, run rate, untracked spend, and project-level burn.
Break spend into work outcomes and drill into repositories, projects, members, teams, themes, and tasks.
## Before you compare the views
Use the same date range, timezone, team, member, repository, project, and agent filters in both views. A different filter or stale sync can make a budget change appear unrelated to its outcome mix.
Spend is attributed from supported coding-agent sessions and available project context. Totals can change after identity mapping, project mapping, provider updates, or late-arriving session data.
## Budget
The **Budget** view answers three questions:
1. How much are we spending now?
2. Which projects are likely to exceed their monthly budgets?
3. How much spend is not governed by a project budget?
 ### Read the spend summary
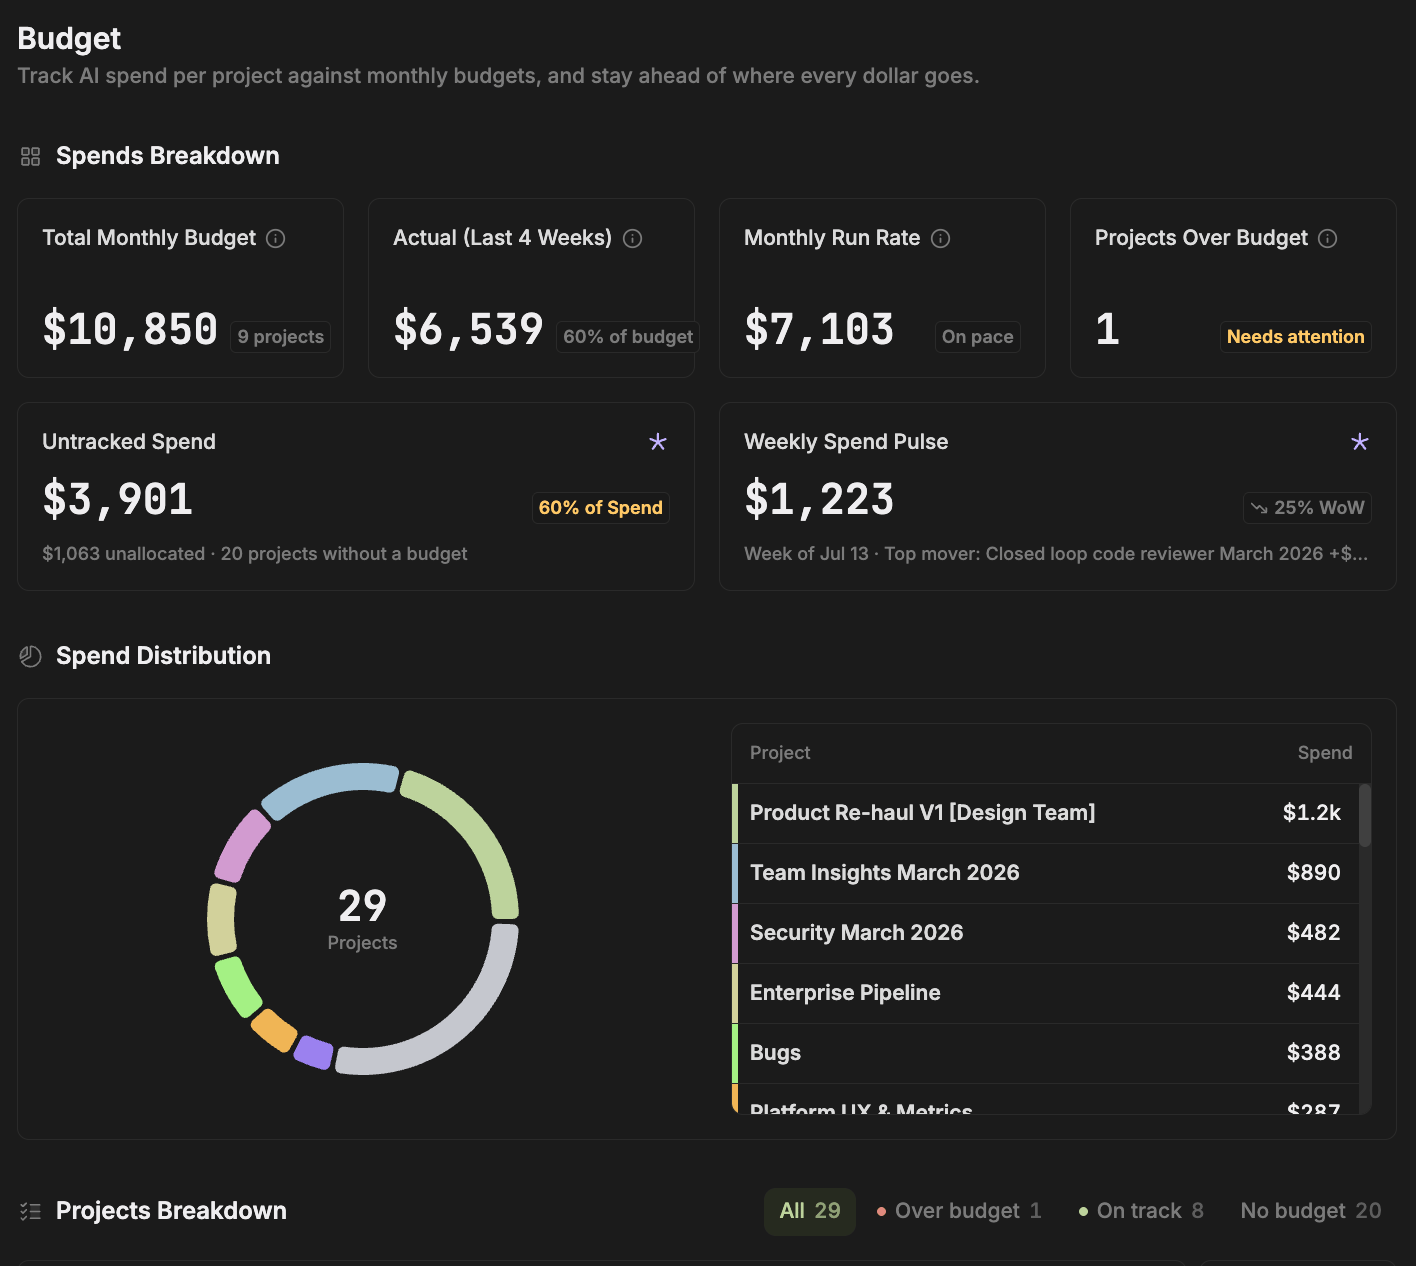
The **Spends Breakdown** cards provide a fast health check.
| Card | What it shows | How to use it |
| ------------------------- | ------------------------------------------------------------------------------------------------------------------------------- | ----------------------------------------------------------------------------------------------------------- |
| **Total Monthly Budget** | The combined monthly budget for projects that have a budget. The project count shows how many projects contribute to the total. | Confirm that the intended projects are covered before treating the total as an organization-wide limit. |
| **Actual (Last 4 Weeks)** | Spend recorded over the trailing four weeks and its share of the configured budget. | Compare actual spend with the run rate; a trailing period can cross calendar-month boundaries. |
| **Monthly Run Rate** | The current spend pace projected to a monthly value. | Use the pace label to spot acceleration before a project crosses its limit. |
| **Projects Over Budget** | The number of budgeted projects whose spend has exceeded the configured limit. | Investigate these projects first, but also review fast-rising projects that are still technically on track. |
Two additional cards expose cost that can be easy to miss:
* **Untracked Spend** shows spend that is unallocated or belongs to projects without a budget. The percentage indicates how much of total spend is outside budget coverage.
* **Weekly Spend Pulse** shows the latest weekly spend, its week-over-week change, and the project that moved the most.
A large untracked percentage is a governance gap, not necessarily waste. Map the sessions to the correct project and set budgets before deciding whether the spend is excessive.
### Inspect spend distribution
**Spend Distribution** shows total spend divided across projects. Use the donut and ranked project list to identify concentration: a project can dominate overall spend while remaining within its own budget.
The distribution includes all visible projects, including projects without budgets. Compare the largest slices with **Untracked Spend** to distinguish high intentional investment from missing budget coverage.
### Use the project breakdown
The **Projects Breakdown** table is the operational view for budget owners. Filter it by:
* **All** — every visible project
* **Over budget** — projects above their configured monthly budget
* **On track** — budgeted projects that have not crossed their limit
* **No budget** — projects receiving spend without a configured budget
Search for a project or sort the table by spend. Each row can include:
| Column | Meaning |
| ------------- | ------------------------------------------------------------------------------------------------------- |
| **Project** | Project name and its open, in-progress, and completed task counts. |
| **Spent** | Spend attributed to the project for the active reporting period. |
| **Vs budget** | Remaining budget or amount over budget. A positive overage is highlighted for attention. |
| **Budget %** | Share of the configured budget already consumed. |
| **Cut/wk** | The weekly reduction or spending target shown by Agent Insights to move the project back toward budget. |
| **Members** | Number of contributors with attributed sessions. |
| **Sessions** | Number of supported agent sessions attributed to the project. |
| **Activity** | A compact recent-spend trend for the project. |
### Read the spend summary
The **Spends Breakdown** cards provide a fast health check.
| Card | What it shows | How to use it |
| ------------------------- | ------------------------------------------------------------------------------------------------------------------------------- | ----------------------------------------------------------------------------------------------------------- |
| **Total Monthly Budget** | The combined monthly budget for projects that have a budget. The project count shows how many projects contribute to the total. | Confirm that the intended projects are covered before treating the total as an organization-wide limit. |
| **Actual (Last 4 Weeks)** | Spend recorded over the trailing four weeks and its share of the configured budget. | Compare actual spend with the run rate; a trailing period can cross calendar-month boundaries. |
| **Monthly Run Rate** | The current spend pace projected to a monthly value. | Use the pace label to spot acceleration before a project crosses its limit. |
| **Projects Over Budget** | The number of budgeted projects whose spend has exceeded the configured limit. | Investigate these projects first, but also review fast-rising projects that are still technically on track. |
Two additional cards expose cost that can be easy to miss:
* **Untracked Spend** shows spend that is unallocated or belongs to projects without a budget. The percentage indicates how much of total spend is outside budget coverage.
* **Weekly Spend Pulse** shows the latest weekly spend, its week-over-week change, and the project that moved the most.
A large untracked percentage is a governance gap, not necessarily waste. Map the sessions to the correct project and set budgets before deciding whether the spend is excessive.
### Inspect spend distribution
**Spend Distribution** shows total spend divided across projects. Use the donut and ranked project list to identify concentration: a project can dominate overall spend while remaining within its own budget.
The distribution includes all visible projects, including projects without budgets. Compare the largest slices with **Untracked Spend** to distinguish high intentional investment from missing budget coverage.
### Use the project breakdown
The **Projects Breakdown** table is the operational view for budget owners. Filter it by:
* **All** — every visible project
* **Over budget** — projects above their configured monthly budget
* **On track** — budgeted projects that have not crossed their limit
* **No budget** — projects receiving spend without a configured budget
Search for a project or sort the table by spend. Each row can include:
| Column | Meaning |
| ------------- | ------------------------------------------------------------------------------------------------------- |
| **Project** | Project name and its open, in-progress, and completed task counts. |
| **Spent** | Spend attributed to the project for the active reporting period. |
| **Vs budget** | Remaining budget or amount over budget. A positive overage is highlighted for attention. |
| **Budget %** | Share of the configured budget already consumed. |
| **Cut/wk** | The weekly reduction or spending target shown by Agent Insights to move the project back toward budget. |
| **Members** | Number of contributors with attributed sessions. |
| **Sessions** | Number of supported agent sessions attributed to the project. |
| **Activity** | A compact recent-spend trend for the project. |
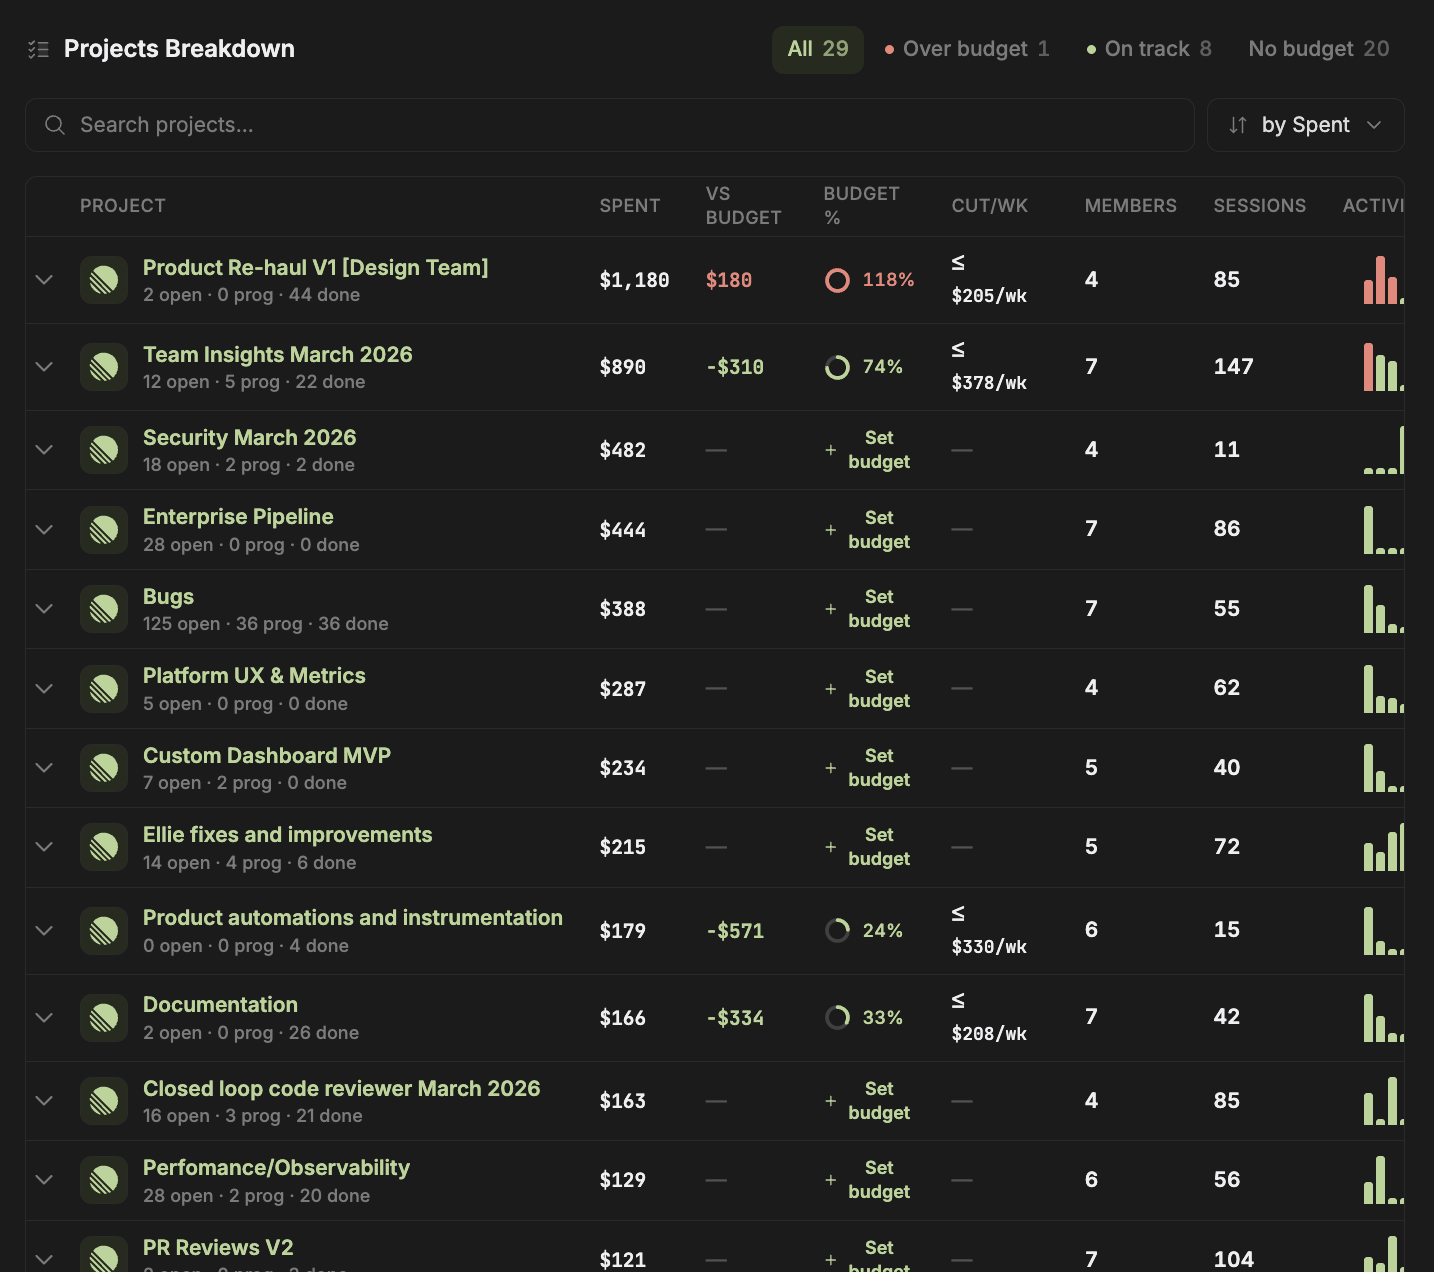 Projects without a budget show **Set budget** instead of budget variance. Add a budget only after confirming that the project mapping and owner are correct.
### Drill into a project
Expand a project row to compare:
* total project spend;
* the percentage of budget consumed;
* weekly actual spend;
* the configured budget line; and
* the recommended weekly pace or reduction shown in the chart.
Use the weekly chart to distinguish a one-time spike from a sustained change. If Slack delivery is configured, **Set Reminder** can send a cost digest so the owner does not have to monitor the dashboard manually.
Projects without a budget show **Set budget** instead of budget variance. Add a budget only after confirming that the project mapping and owner are correct.
### Drill into a project
Expand a project row to compare:
* total project spend;
* the percentage of budget consumed;
* weekly actual spend;
* the configured budget line; and
* the recommended weekly pace or reduction shown in the chart.
Use the weekly chart to distinguish a one-time spike from a sustained change. If Slack delivery is configured, **Set Reminder** can send a cost digest so the owner does not have to monitor the dashboard manually.
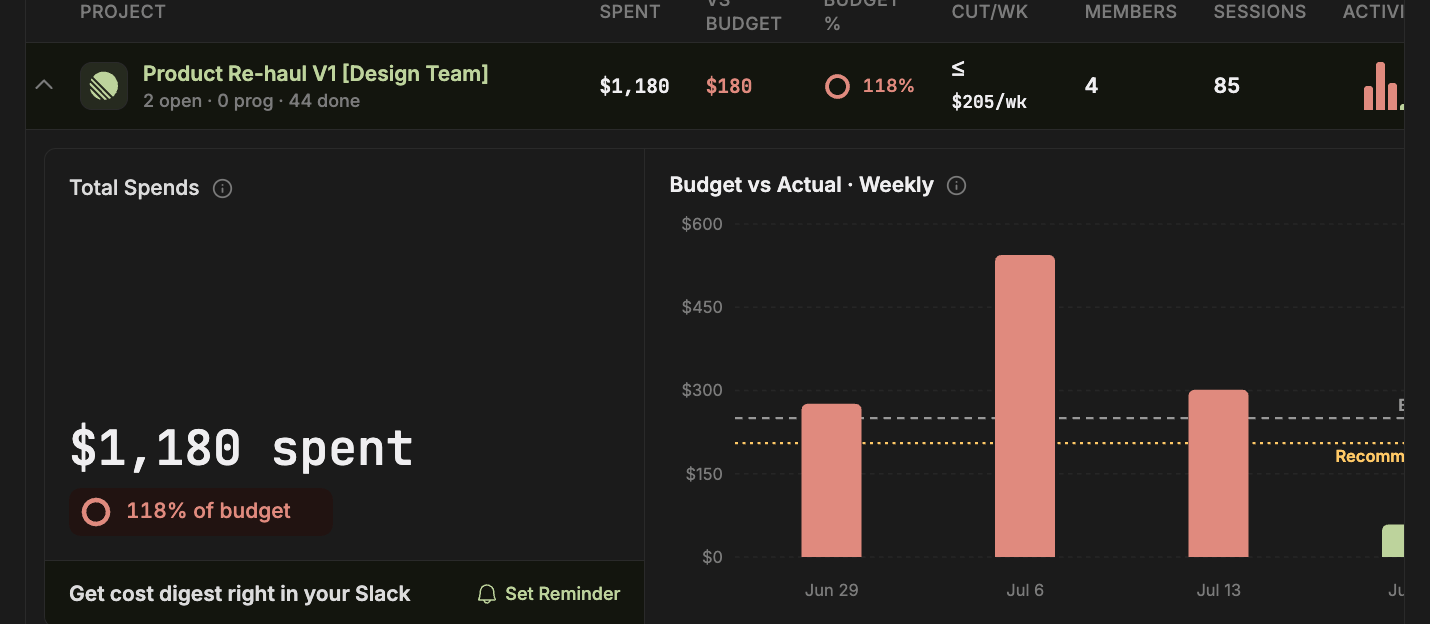 Check the project name, members, sessions, and task counts. Resolve unmapped or misattributed sessions first.
Compare weekly bars with the budget line and locate the week where spend accelerated.
Keep the same date range and project filter, then inspect which outcome classes and themes grew.
Correct mapping, add a missing budget, reduce retries, improve context, adjust routing, or change the budget only after the cause is clear.
## Outcomes
The **Outcomes** view connects spend with the work performed in supported coding-agent sessions. It is intended for understanding the shape of work, not for measuring individual performance.
### Read the outcome breakdown
**Outcome Breakdown** starts with total spend and divides it into four classes.
Check the project name, members, sessions, and task counts. Resolve unmapped or misattributed sessions first.
Compare weekly bars with the budget line and locate the week where spend accelerated.
Keep the same date range and project filter, then inspect which outcome classes and themes grew.
Correct mapping, add a missing budget, reduce retries, improve context, adjust routing, or change the budget only after the cause is clear.
## Outcomes
The **Outcomes** view connects spend with the work performed in supported coding-agent sessions. It is intended for understanding the shape of work, not for measuring individual performance.
### Read the outcome breakdown
**Outcome Breakdown** starts with total spend and divides it into four classes.
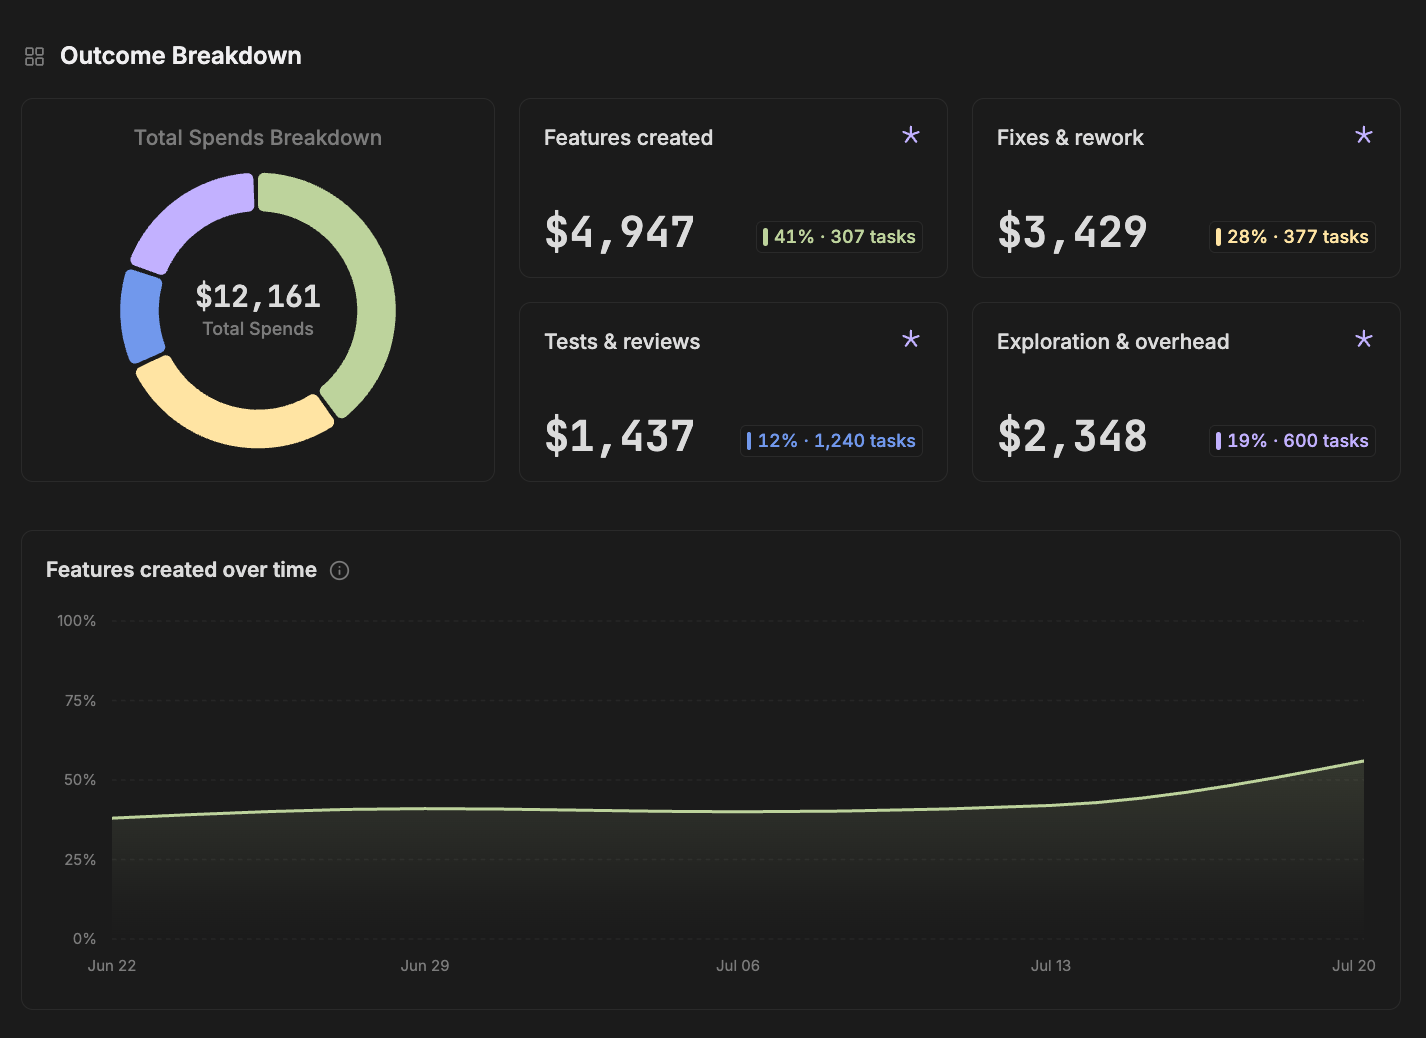 | Outcome | Includes work such as | Questions to ask |
| -------------------------- | -------------------------------------------------------------------- | --------------------------------------------------------------------------------------------- |
| **Features created** | New product behavior, implementation, and feature delivery. | Did feature spend rise because scope or delivery increased? |
| **Fixes & rework** | Bug fixes, corrections, refactors, and repeated work. | Is the change planned maintenance, healthy iteration, or avoidable rework? |
| **Tests & reviews** | Testing, validation, review, evaluation, and quality work. | Is the level appropriate for the risk and release stage? |
| **Exploration & overhead** | Investigation, planning, setup, research, and other supporting work. | Did discovery prevent bad implementation, or is missing context causing repeated exploration? |
Each card shows spend, share of total spend, and task count. A high task count with low spend can mean many small tasks; a low task count with high spend can point to a few expensive themes that deserve inspection.
The trend chart shows how the selected outcome share changes over time. Use it to determine whether a shift is persistent or limited to a release, migration, incident, or evaluation period.
Outcome classes are derived from available task and session context. They are directional analytics, not accounting codes or a quality score. Validate representative tasks before using a category in financial, staffing, or performance decisions.
### Find where spend happened
The **Where it happened?** section can group the same outcome mix:
* **By Repos**
* **By Projects**
* **By Member**
* **By Team**
| Outcome | Includes work such as | Questions to ask |
| -------------------------- | -------------------------------------------------------------------- | --------------------------------------------------------------------------------------------- |
| **Features created** | New product behavior, implementation, and feature delivery. | Did feature spend rise because scope or delivery increased? |
| **Fixes & rework** | Bug fixes, corrections, refactors, and repeated work. | Is the change planned maintenance, healthy iteration, or avoidable rework? |
| **Tests & reviews** | Testing, validation, review, evaluation, and quality work. | Is the level appropriate for the risk and release stage? |
| **Exploration & overhead** | Investigation, planning, setup, research, and other supporting work. | Did discovery prevent bad implementation, or is missing context causing repeated exploration? |
Each card shows spend, share of total spend, and task count. A high task count with low spend can mean many small tasks; a low task count with high spend can point to a few expensive themes that deserve inspection.
The trend chart shows how the selected outcome share changes over time. Use it to determine whether a shift is persistent or limited to a release, migration, incident, or evaluation period.
Outcome classes are derived from available task and session context. They are directional analytics, not accounting codes or a quality score. Validate representative tasks before using a category in financial, staffing, or performance decisions.
### Find where spend happened
The **Where it happened?** section can group the same outcome mix:
* **By Repos**
* **By Projects**
* **By Member**
* **By Team**
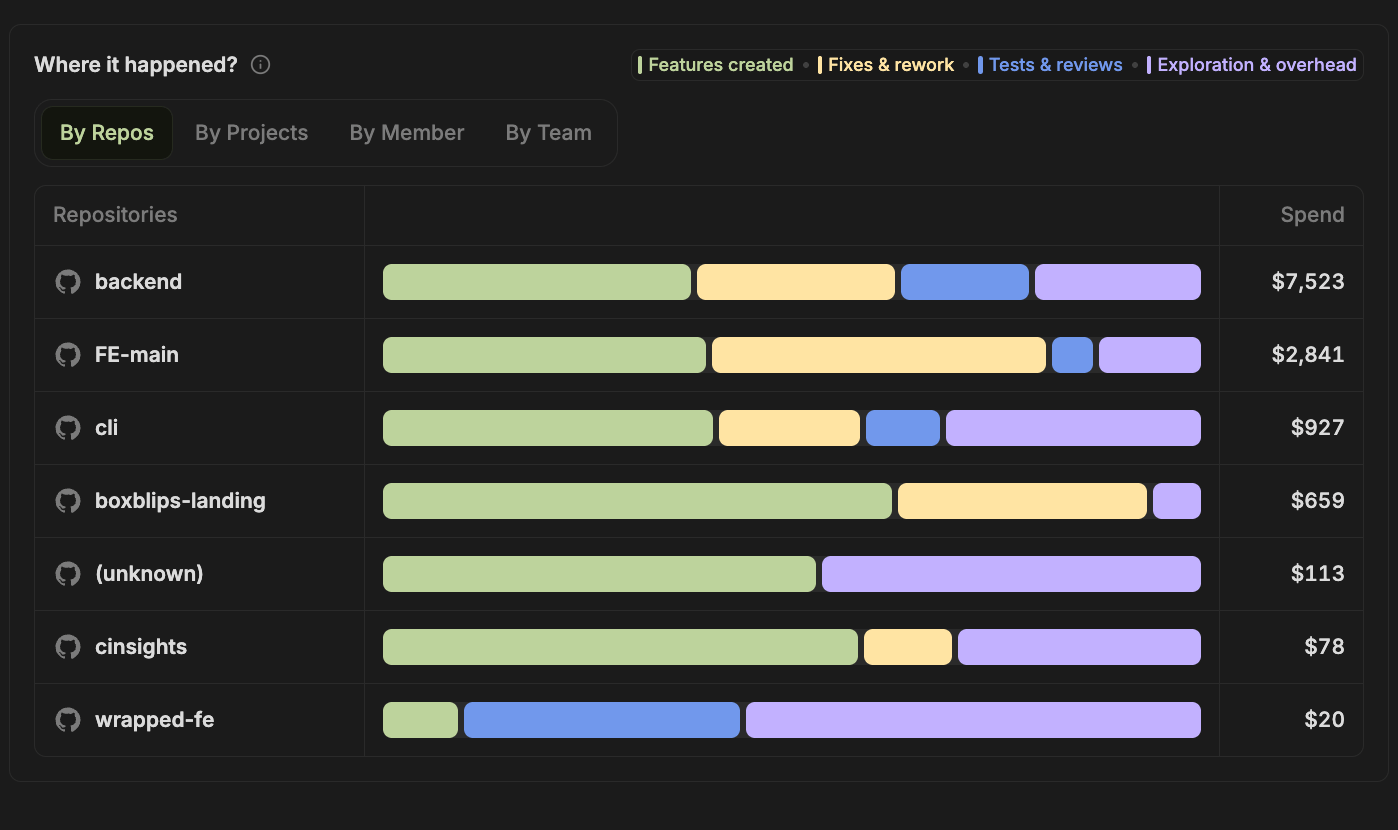
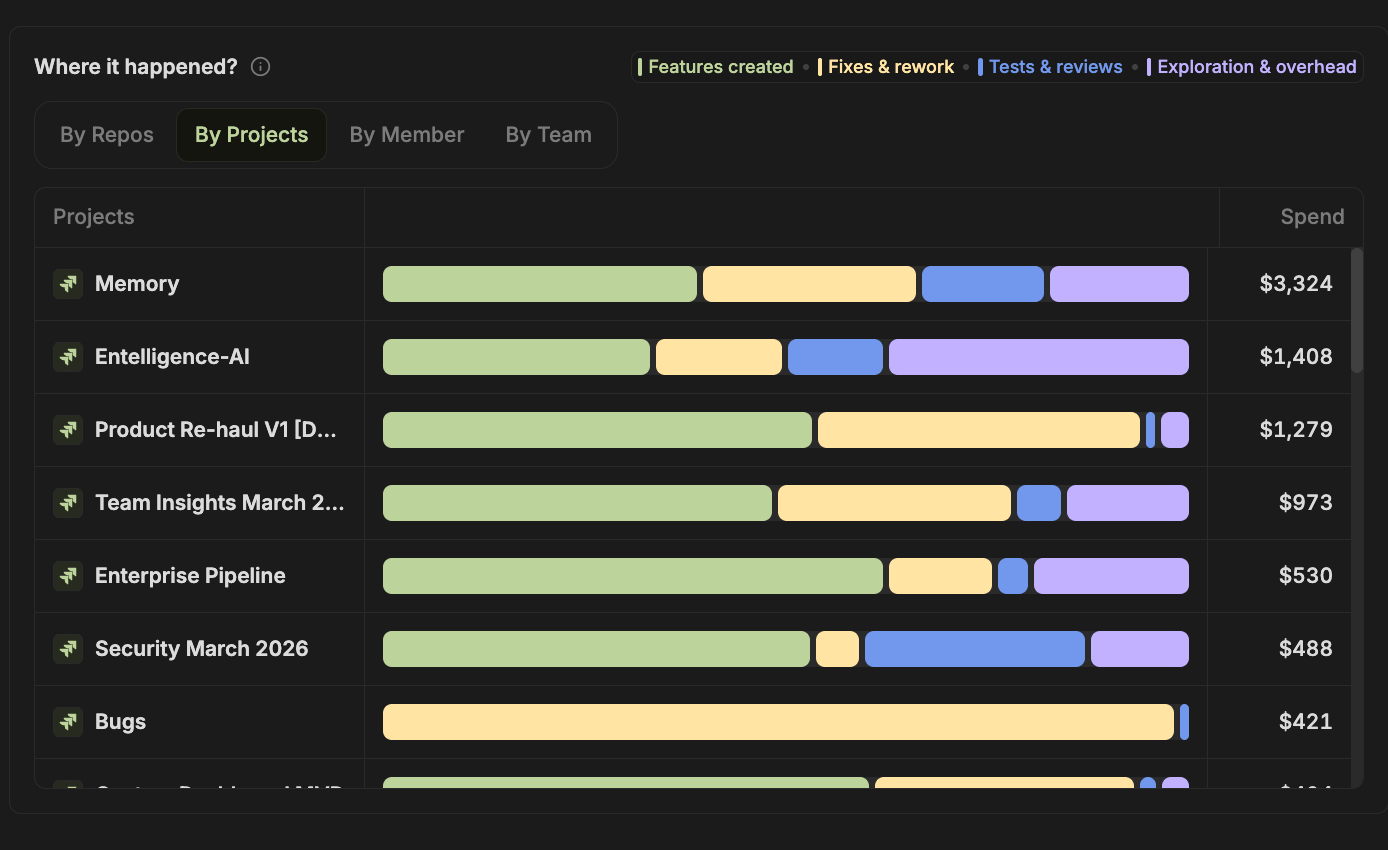 Each row combines a stacked outcome bar with total spend. The bar explains the mix; the spend column explains the scale. For example, two repositories may have similar percentages but very different financial impact.
Use the grouping that matches the decision:
* choose **By Repos** for codebase or platform questions;
* choose **By Projects** for budget ownership and delivery planning;
* choose **By Member** for enablement conversations and data-quality checks, not ranking;
* choose **By Team** for operating-model and investment discussions.
### Inspect themes and tasks
Open a theme to view **Theme Details**. The detail panel can include:
* a generated theme name and summary;
* total cost and change in activity;
* repositories represented;
* total tokens;
* task count;
* member count;
* the theme date range; and
* a session-activity timeline.
Each row combines a stacked outcome bar with total spend. The bar explains the mix; the spend column explains the scale. For example, two repositories may have similar percentages but very different financial impact.
Use the grouping that matches the decision:
* choose **By Repos** for codebase or platform questions;
* choose **By Projects** for budget ownership and delivery planning;
* choose **By Member** for enablement conversations and data-quality checks, not ranking;
* choose **By Team** for operating-model and investment discussions.
### Inspect themes and tasks
Open a theme to view **Theme Details**. The detail panel can include:
* a generated theme name and summary;
* total cost and change in activity;
* repositories represented;
* total tokens;
* task count;
* member count;
* the theme date range; and
* a session-activity timeline.
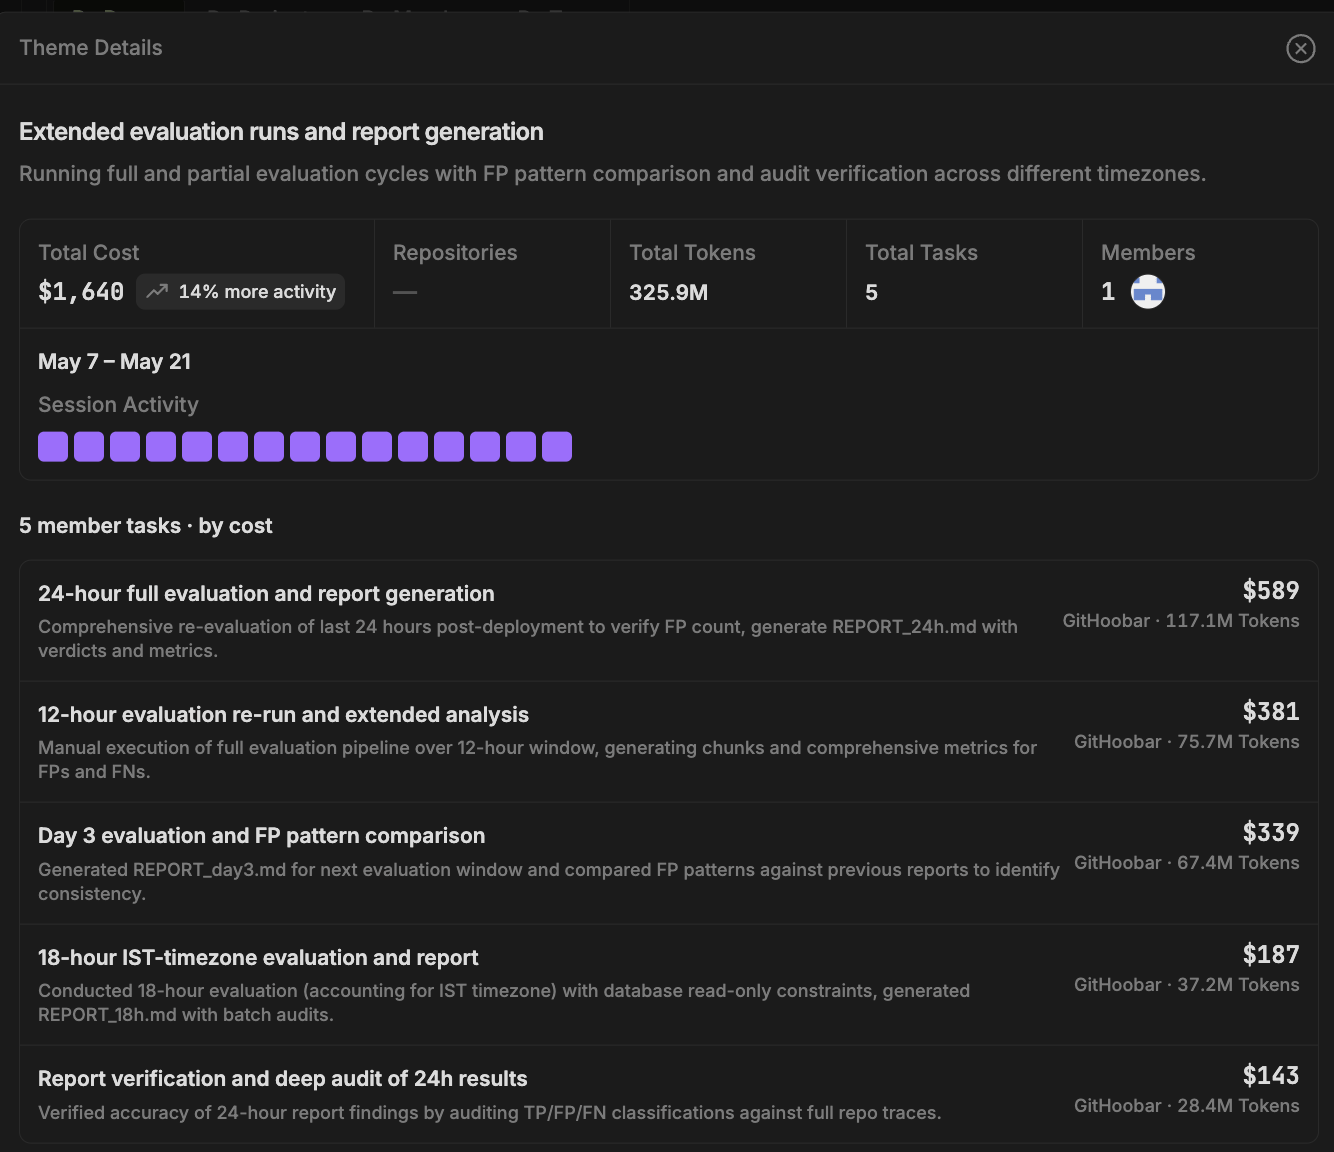 Below the summary, tasks are ranked by cost. Each task can show its title, generated description, agent or model source, token count, and spend. This is the most useful level for validating whether a category or theme accurately represents the underlying work.
When a theme is expensive, review several tasks rather than only the highest-cost one. A single long evaluation run, repeated retry loop, or generated report can distort the theme total.
## Investigate a spend change
Start with Projects Over Budget, Weekly Spend Pulse, or a project whose run rate is accelerating.
Apply the same time, project, repository, team, member, and agent filters.
Compare outcome shares, task counts, and the trend chart. Look for a category that grew faster than total activity.
Switch among repository, project, member, and team groupings to isolate where the change occurred.
Open the dominant themes and inspect several high-cost and typical tasks, including their descriptions, tokens, and session activity.
Improve project mapping, repository context, task scoping, review policy, agent configuration, model routing, or budget coverage as appropriate.
## Common interpretation mistakes
* **Treating untracked spend as overspend.** It may reflect missing project mapping or a project with no budget.
* **Comparing a trailing four-week actual with a calendar-month budget without noting the difference.**
* **Using outcome percentages without total spend or task counts.** A category share can rise while its dollar amount falls.
* **Assuming fixes and rework are always negative.** Planned maintenance and incident response can legitimately dominate a period.
* **Ranking people from member-level spend.** Role, task complexity, tooling, data coverage, and model choice all affect cost.
* **Changing budgets before validating themes and tasks.** Budget variance is a prompt to investigate, not proof of inefficiency.
## Pair with Model Router
Agent Insights explains how supported coding agents are used. [Model Router](/model-router/overview) controls routing for supported traffic. After a routing change, compare spend, sessions, outcome mix, task quality, and developer feedback before deciding whether the change worked.
## Next step
Review [Agent Insights metrics and data](/agent-insights/metrics) for metric definitions, [members and skills](/agent-insights/members) for adoption workflows, or the [metrics glossary](/reference/metrics) for cross-product terminology.
Below the summary, tasks are ranked by cost. Each task can show its title, generated description, agent or model source, token count, and spend. This is the most useful level for validating whether a category or theme accurately represents the underlying work.
When a theme is expensive, review several tasks rather than only the highest-cost one. A single long evaluation run, repeated retry loop, or generated report can distort the theme total.
## Investigate a spend change
Start with Projects Over Budget, Weekly Spend Pulse, or a project whose run rate is accelerating.
Apply the same time, project, repository, team, member, and agent filters.
Compare outcome shares, task counts, and the trend chart. Look for a category that grew faster than total activity.
Switch among repository, project, member, and team groupings to isolate where the change occurred.
Open the dominant themes and inspect several high-cost and typical tasks, including their descriptions, tokens, and session activity.
Improve project mapping, repository context, task scoping, review policy, agent configuration, model routing, or budget coverage as appropriate.
## Common interpretation mistakes
* **Treating untracked spend as overspend.** It may reflect missing project mapping or a project with no budget.
* **Comparing a trailing four-week actual with a calendar-month budget without noting the difference.**
* **Using outcome percentages without total spend or task counts.** A category share can rise while its dollar amount falls.
* **Assuming fixes and rework are always negative.** Planned maintenance and incident response can legitimately dominate a period.
* **Ranking people from member-level spend.** Role, task complexity, tooling, data coverage, and model choice all affect cost.
* **Changing budgets before validating themes and tasks.** Budget variance is a prompt to investigate, not proof of inefficiency.
## Pair with Model Router
Agent Insights explains how supported coding agents are used. [Model Router](/model-router/overview) controls routing for supported traffic. After a routing change, compare spend, sessions, outcome mix, task quality, and developer feedback before deciding whether the change worked.
## Next step
Review [Agent Insights metrics and data](/agent-insights/metrics) for metric definitions, [members and skills](/agent-insights/members) for adoption workflows, or the [metrics glossary](/reference/metrics) for cross-product terminology.